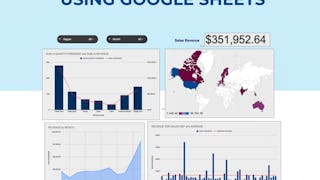
Learn how to create data visualizations and dashboards using spreadsheets and analytics tools. This course covers some of the first steps for telling a compelling story with your data using various types of charts and graphs. You'll learn the basics of visualizing data with Excel and IBM Cognos Analytics without having to write any code.


Data Visualization and Dashboards with Excel and Cognos
This course is part of multiple programs.


Instructors: Sandip Saha Joy
188,144 already enrolled
Included with 
(4,182 reviews)
Recommended experience
What you'll learn
Create basic visualizations such as line graphs, bar graphs, and pie charts using Excel spreadsheets.
Explain the important role charts play in telling a data-driven story.
Construct advanced charts and visualizations such as Treemaps, Sparklines, Histogram, Scatter Plots, and Filled Map Charts.
Build and share interactive dashboards using Excel and Cognos Analytics.
Skills you'll gain
Details to know

Add to your LinkedIn profile
2 quizzes, 8 assignments
See how employees at top companies are mastering in-demand skills

Build your subject-matter expertise
- Learn new concepts from industry experts
- Gain a foundational understanding of a subject or tool
- Develop job-relevant skills with hands-on projects
- Earn a shareable career certificate

There are 4 modules in this course
In this module, you will be introduced to the basics of charts and the Excel functions that are used to create basic charts and pivot chart visualizations. By learning how to manipulate these features and creating visualizations, you will begin to understand the important role charts play in telling a data-driven story.
What's included
6 videos4 readings1 quiz1 assignment2 plugins
In this module, you will learn about creating advanced charts and visualizations and learn about the basics of dashboarding and how to create a simple dashboard using a spreadsheet.
What's included
5 videos2 readings1 quiz3 assignments2 plugins
In this module, you will be introduced to another dashboarding solution called Cognos Analytics. After registering with Cognos Analytics, you will then explore the platform capabilities by creating visualizations, building a simple dashboard, and discovering its advanced features. Optionally, you can explore Google Looker Studio to create visualizations and build dashboards.
What's included
4 videos6 readings4 assignments6 plugins
Congratulations! You have now completed the modules for this course. In this module, you will complete the final assignment that will be graded by your peers. In the first part of the final assignment, you will use provided sample data to create some visualizations using Excel for the web. In the second part of the final assignment, you will create some visualizations and add them to a dashboard using Cognos Analytics or Google Looker Studio.
What's included
2 readings1 peer review4 plugins
Earn a career certificate
Add this credential to your LinkedIn profile, resume, or CV. Share it on social media and in your performance review.
Instructors

Offered by
Explore more from Data Analysis
 Status: Free Trial
Macquarie University
 Status: Free Trial
 Status: Free
Coursera Project Network
 Status: Free
Coursera Project Network
Why people choose Coursera for their career


Learner reviews
4,182 reviews
- 5 stars
77.80%
- 4 stars
17.43%
- 3 stars
2.77%
- 2 stars
1.05%
- 1 star
0.93%
Showing 3 of 4182
Reviewed on Jan 20, 2022
Familiarity with the powerful Cognus program was very good. If you continue this course, good things will surely happen to you. This was the third course I took and it was really great
Reviewed on Aug 10, 2022
Having taking the tutorial class, i can say it enriched me with alot of information about Data Analytics. Tools for visualization such as Excel and Cognos, gives important clearity about data.
Reviewed on Mar 18, 2024
In general the course was great. The only thing is that for very beginners is really difficult to grasp even after a few attempts, therefore instructions should be broken down more in detail.
New to Data Analysis? Start here.

Open new doors with Coursera Plus
Unlimited access to 10,000+ world-class courses, hands-on projects, and job-ready certificate programs - all included in your subscription
Advance your career with an online degree
Earn a degree from world-class universities - 100% online
Join over 3,400 global companies that choose Coursera for Business
Upskill your employees to excel in the digital economy
Frequently asked questions
Access to lectures and assignments depends on your type of enrollment. If you take a course in audit mode, you will be able to see most course materials for free. To access graded assignments and to earn a Certificate, you will need to purchase the Certificate experience, during or after your audit. If you don't see the audit option:
The course may not offer an audit option. You can try a Free Trial instead, or apply for Financial Aid.
The course may offer 'Full Course, No Certificate' instead. This option lets you see all course materials, submit required assessments, and get a final grade. This also means that you will not be able to purchase a Certificate experience.
When you enroll in the course, you get access to all of the courses in the Certificate, and you earn a certificate when you complete the work. Your electronic Certificate will be added to your Accomplishments page - from there, you can print your Certificate or add it to your LinkedIn profile. If you only want to read and view the course content, you can audit the course for free.
If you subscribed, you get a 7-day free trial during which you can cancel at no penalty. After that, we don’t give refunds, but you can cancel your subscription at any time. See our full refund policy.
More questions
Financial aid available,


