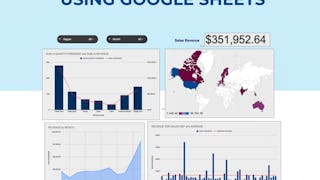
In this project, you will learn how to create charts in Microsoft Excel to analyze sales data of a sample company. You will learn how to create PivotTables to assess different aspects of the sales information, and represent the information from the tables as line, bar, and pie charts. When creating the charts, you will learn how to format them so they are easily interpreted and you will then assemble the charts in a dashboard to provide a global picture of the sales data.


Create Charts and Dashboards Using Microsoft Excel

Instructor: Paula Del Rey
78,598 already enrolled
Included with 
(925 reviews)
Recommended experience
What you'll learn
Create PivotTables to assess specific relationships within the data.
Create line, bar, and pie charts to present the information from the PivotTables.
Compose a dashboard with the charts and tables created to present a global picture of the data.
Skills you'll practice
Details to know

Add to your LinkedIn profile
Only available on desktop
See how employees at top companies are mastering in-demand skills

Learn, practice, and apply job-ready skills in less than 2 hours
- Receive training from industry experts
- Gain hands-on experience solving real-world job tasks
- Build confidence using the latest tools and technologies

About this Guided Project
Learn step-by-step
In a video that plays in a split-screen with your work area, your instructor will walk you through these steps:
Upload a document using the free online version of Microsoft Office 365
Create PivotTables in Microsoft Excel
Create and format a Line Chart in Microsoft Excel to represent sales profits by month
Create and format a Bar Chart in Microsoft Excel to represent sales profits by Salesperson
Create and format Pie Charts in Microsoft Excel to represent sales percentages by product category and city
Create a Dashboard in Microsoft Excel containing charts and tables
Recommended experience
Basic knowledge of spreadsheets
7 project images
Instructor

Offered by
How you'll learn
Skill-based, hands-on learning
Practice new skills by completing job-related tasks.
Expert guidance
Follow along with pre-recorded videos from experts using a unique side-by-side interface.
No downloads or installation required
Access the tools and resources you need in a pre-configured cloud workspace.
Available only on desktop
This Guided Project is designed for laptops or desktop computers with a reliable Internet connection, not mobile devices.
Why people choose Coursera for their career


Learner reviews
925 reviews
- 5 stars
76.10%
- 4 stars
17.83%
- 3 stars
2.48%
- 2 stars
0.75%
- 1 star
2.81%
Showing 3 of 925
Reviewed on Aug 22, 2024
Very good refresher if you've used excel at this level. Also easy to understand for someone who's never used excel
Reviewed on Feb 15, 2023
GOOD AND HELP FULL COURSE IN DETAILS AND FINANCIAL AID FACILTIES ARE FOR WHO CANT PAY FEES THIS COURSE OF COURSERA IS GOOD AND VALUEABLE
Reviewed on Jun 24, 2023
The teacher was excellent, very clear communication. I liked how she had us pause and try it ourselves before showing us the answer, I learned better that way having to think it through myself.
You might also like
 Status: Free
Coursera Project Network


Coursera Project Network
 Status: Free Trial
 Status: Free Trial
Corporate Finance Institute
New to Business Essentials? Start here.

Open new doors with Coursera Plus
Unlimited access to 10,000+ world-class courses, hands-on projects, and job-ready certificate programs - all included in your subscription
Advance your career with an online degree
Earn a degree from world-class universities - 100% online
Join over 3,400 global companies that choose Coursera for Business
Upskill your employees to excel in the digital economy
Frequently asked questions
Because your workspace contains a cloud desktop that is sized for a laptop or desktop computer, Guided Projects are not available on your mobile device.
Guided Project instructors are subject matter experts who have experience in the skill, tool or domain of their project and are passionate about sharing their knowledge to impact millions of learners around the world.
You can download and keep any of your created files from the Guided Project. To do so, you can use the “File Browser” feature while you are accessing your cloud desktop.


